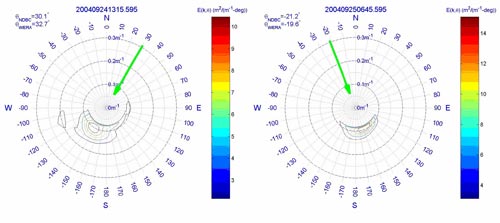
Directional wave spectra have been estimated using the Wyatt et al. (2003) techniques on both the South Atlantic Bight and Southeast Florida Shelf WERA data using a few day samples (Figure 11). Results suggest that the directional wave estimates are sensitive to both the length of the phased array (12 Rx versus 16 Rx) and the length of the sample. Tests with 2048 samples (20-minute samples) revealed less noise and more steady estimates than those with just 1024 samples (10 minutes). Directional wave spectra from the WERA measurements are shown for the passage of Jeanne over the WERA grid near to the Fowey Rocks measurement site. These wave spectra are possible from the second-order Doppler spectral returns by an integral inversion technique. The wind seas respond to the strong wind stresses containing most of the wind-driven energy. By contrast, there was little indication of a strong low-frequency wave (swell) component moving with the storm since the islands presumably filtered out this faster moving wave component. These strong wind-driven current events are being looked at more closely to assess the performance of WERA surface current mapping and the accurate determination of the forced surface wave directional spectrum from the mini-waves experiment conducted in Spring 2005.
Significant Wave Height. Estimation of the wave field at discrete grid points is an advantage of the BF-approach over the DF approach in estimating significant wave height (Hs) and wave direction as part of the standard distribution, using the empirical estimation technique of Essen et al. [1999] and Gurgel et al. [2006]. The estimation of directional wave spectra at each point is also possible based on the inversion techniques of Wyatt et al. [2003]. Preliminary assessment of the standard distribution wave product has begun suggesting that inclusion of a bathymetric correction (possible in existing software) may be necessary for the lower frequency systems (i.e. < 10 MHz). The significant wave heights can be determined over about 60% of the radar footprint. By contrast, DF radar uses the Doppler spectrum measured at a fixed range close to the radar site to estimate significant wave heights [Wyatt, 2005]. This spectrum integrates backscatter over all angles from the radar site and its inversion requires knowledge of the beam pattern. The DF approach either doesn't have sufficient SNR to extend the wave measurement beyond a range close to the radar site or current variability makes it much more difficult to separate 1st and 2nd order returns contained within the Doppler spectrum at the longer ranges that encompass a wider area. The following image depicts wave height with increasing distance from the coast. Note this is a 1-D visualization of the data for simplicity. The radar output is a 2-D field of wave height and direction.
